SARS-CoV-2_phylogeo
SARS-CoV-2 Delta variant: balanced temporal sampling. Equal rates in/out Norway ================ 20/12/2021
Phylogeographic mapping
The analyses take a dated phylogeny exported from NextStrain as a starting point for quantifying imports and local transmission of Sars-CoV-2 Delta variant in Norway. Each isolate is assigned to one of two binary categories: “Norway” or “Rest of the world (RoW)”. The output is presented in Fig.1 and ancestral character estimation performed on the dated phylogeny.
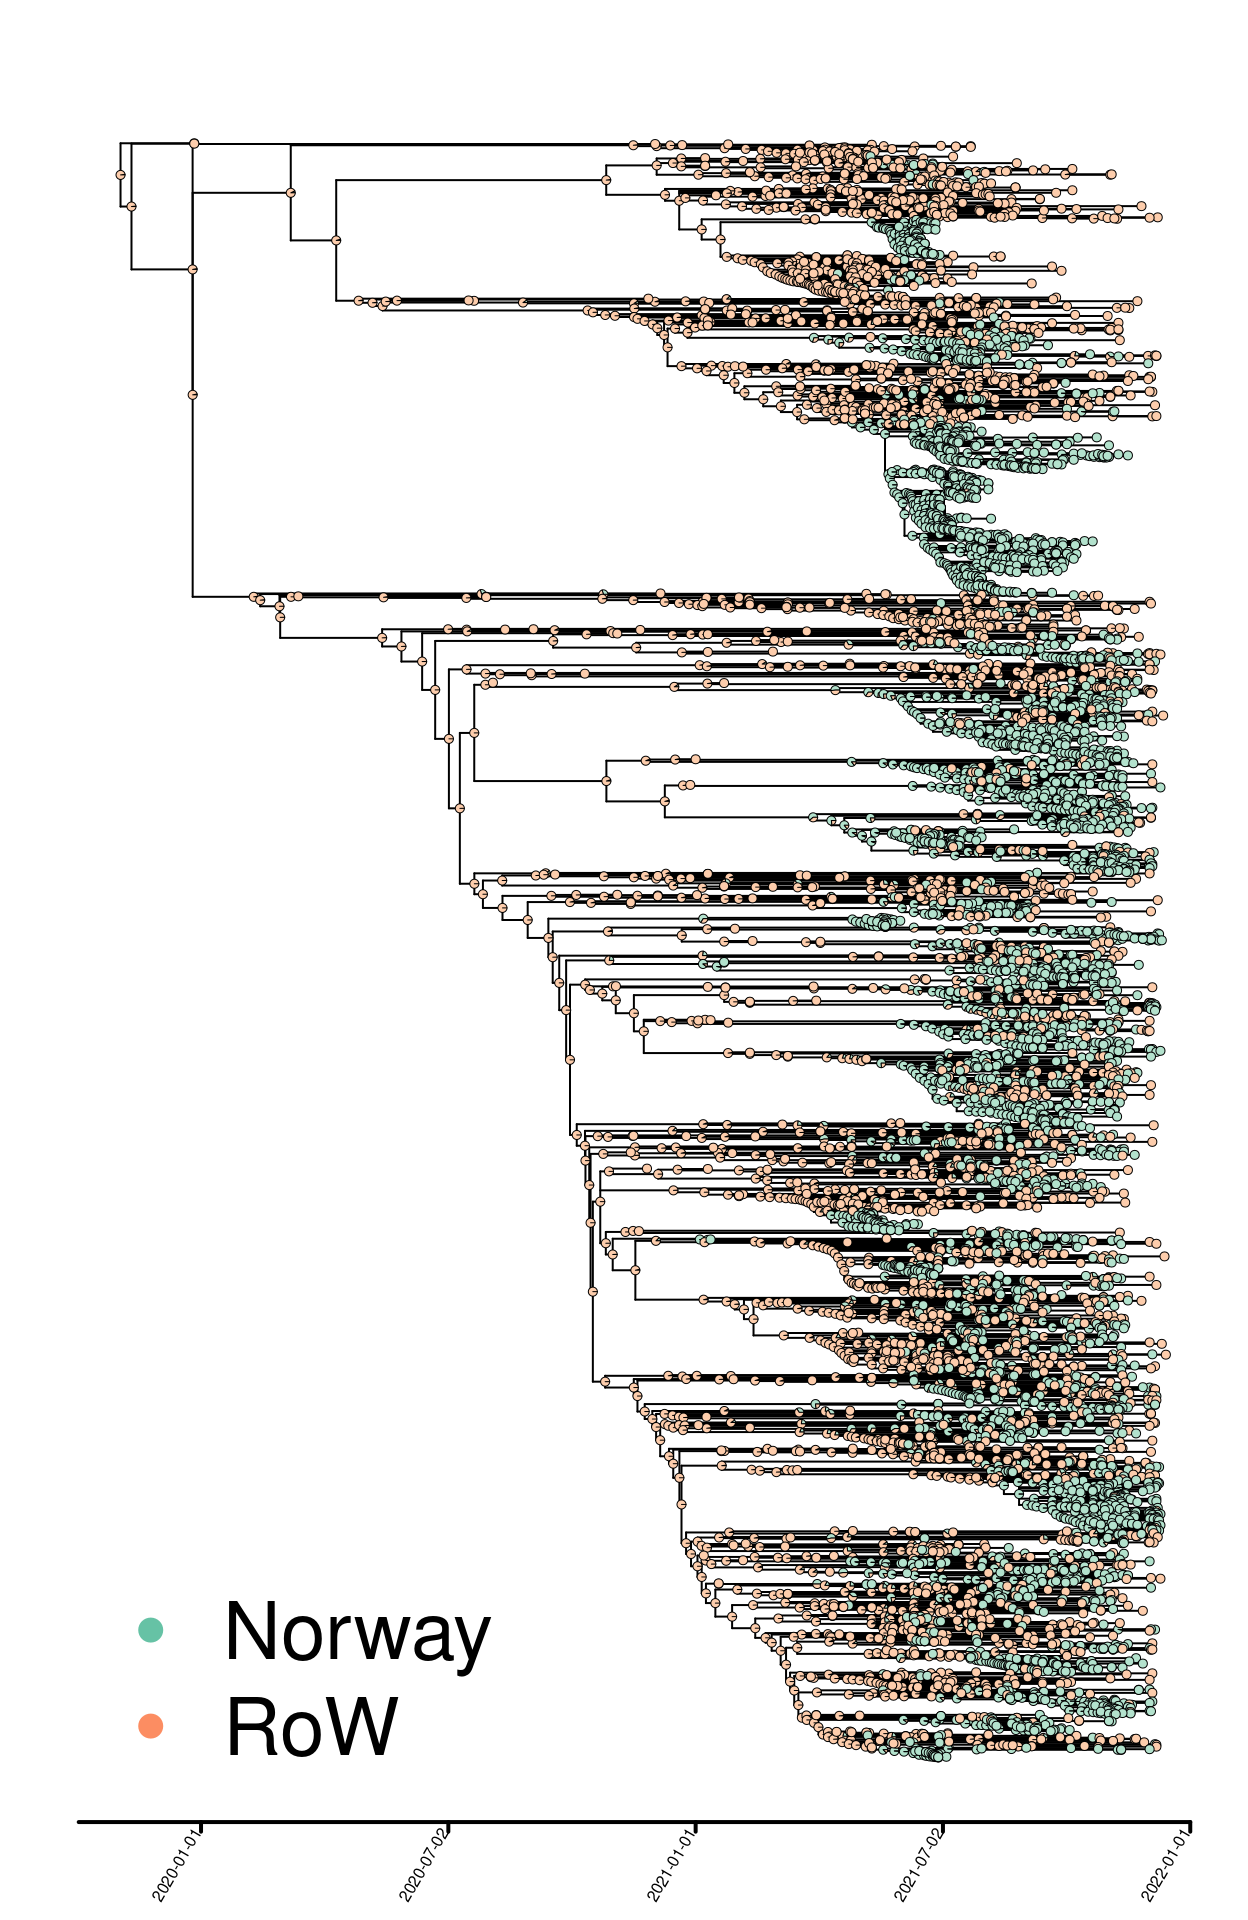
Fig. 1. Delta phylogeny colored by binary geographic mappings (Norway, rest of the world [RoW]).
Quantifying introductions and local transmission
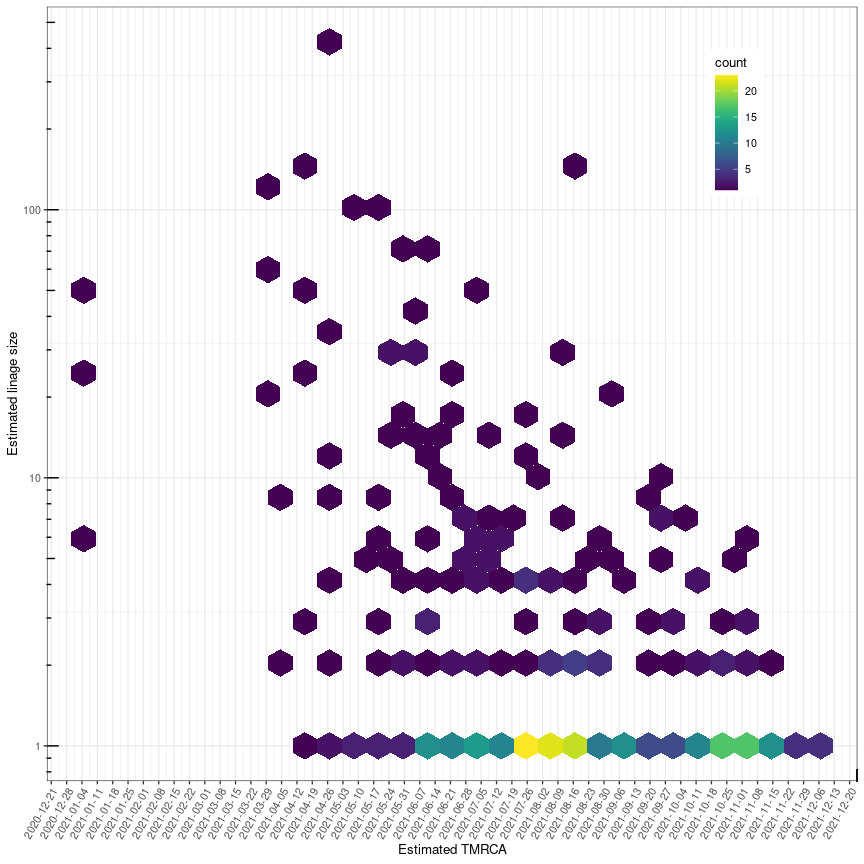
Below is a visualization of the size of each transmission lineage detected in Norway.
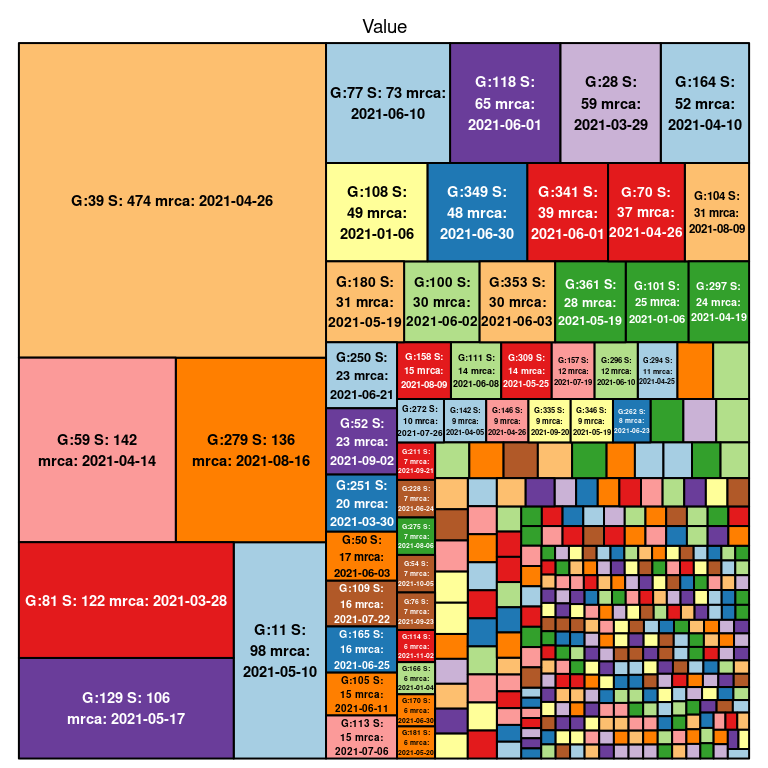 ##### Fig. 2. Delta transmission lineage sizes in Norway. G denotes
the number assigned to each lineage, S denotes the size of the lineage
and TMRCA denotes the age of the lineage.
##### Fig. 2. Delta transmission lineage sizes in Norway. G denotes
the number assigned to each lineage, S denotes the size of the lineage
and TMRCA denotes the age of the lineage.
Table 1. Estimated number of infections in Norway resulting from import and local transmission based on the phylogeographic analyses in Figure 1.
| 2.5% | 50% | 97.5% | |
|---|---|---|---|
| Import | 395.2250 | 402.500 | 406.0000 |
| Local transmission | 2157.0000 | 2160.500 | 2167.7750 |
| Import / Total | 0.1542 | 0.157 | 0.1584 |
Next, we estimate the fraction of introductions relative to local transmission over time. In these and subsequent analyses it is important to keep detection lag into account (see https://science.sciencemag.org/content/371/6530/708). There will always be a delay between the introduction and detection, which varies from case to case. In the figures below, the last four weeks prior to the time of sampling of the most recent included isolate is shaded to indicate that estimates in this period is highly uncertain.
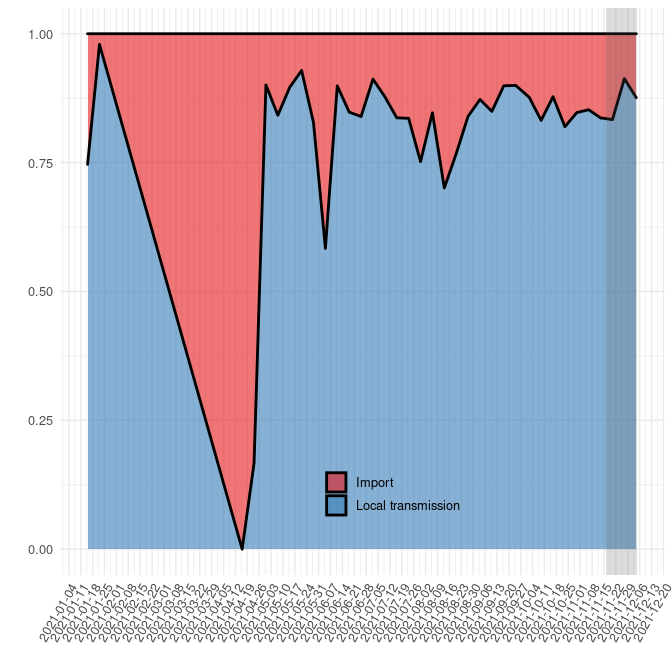 ##### Fig. 3. Relative quantification of infection source (new
introduction / import vs local transmission). Grey shading indicates
that inferences in this period (last 4 weeks) are uncertain due to
detection lag.
##### Fig. 3. Relative quantification of infection source (new
introduction / import vs local transmission). Grey shading indicates
that inferences in this period (last 4 weeks) are uncertain due to
detection lag.
The same output is visualized as absolute numbers in Fig. 3 below. It should be noted that absolute estimates will be significantly shaped by sampling density.
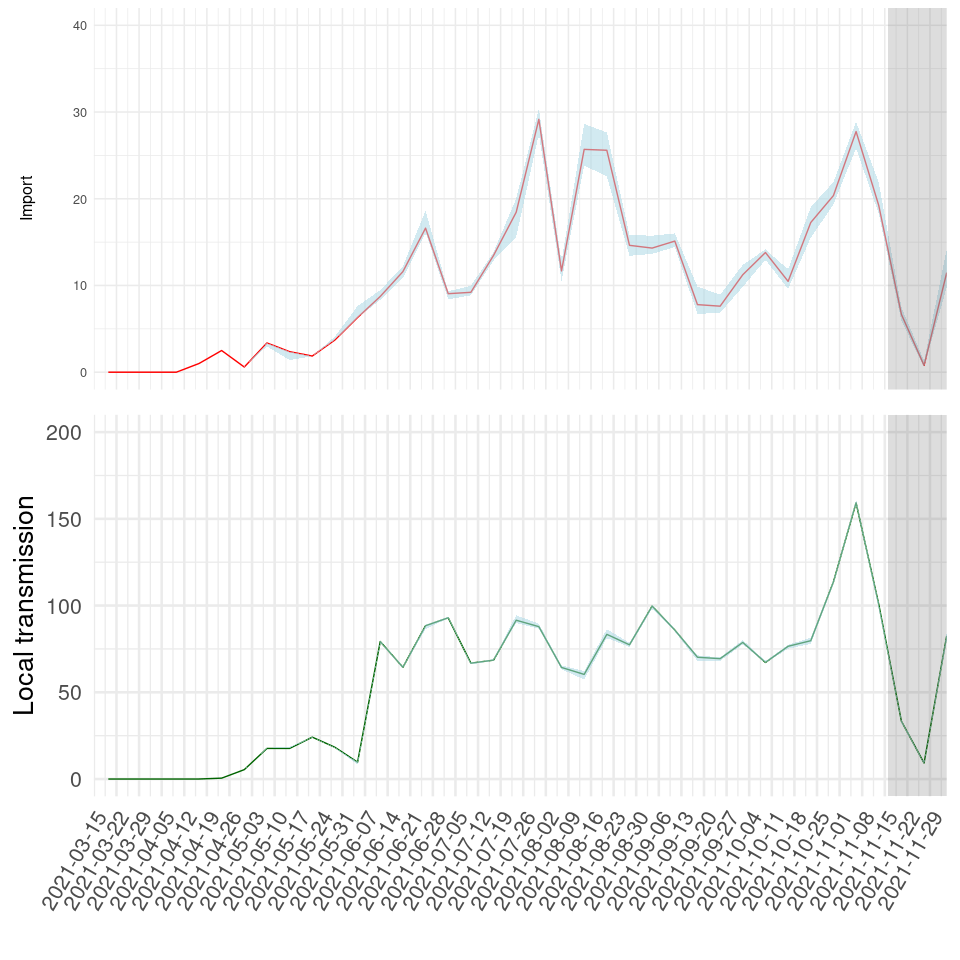
Fig. 4. Absolute quantification of imports and local transmission events. Grey shading indicates that inferences in this period (last 4 weeks) are uncertain due to detection lag.
Perhaps the most interesting aspect of quantifying introductions, is to investigate the fate of the introduced viruses. Mandatory testing at the border and/or mandatory quaranteens etc will obviously have a bearing on the fate of new introductions from abroad. The plot below visualizes the number of infections in Norway resulting from each identified virus import event over time, stratified by inferred TMRCA of each introduced lineage.